


In Europe, the market is on a downward trend this week as the Troll field in Norway is reducing production beyond the scope of earlier maintenance plans, natural gas inventories rose to a high but decreased, but TTF futures prices fell as stocks in the region are now too abundant.
In the United States, on July 28, local time, the natural gas pipeline that broke down near Strasburg, Virginia, returned to normal flow, and the delivery of natural gas to the Cove Point liquefied natural gas terminal returned to normal, and the Port Henry natural gas (NG) futures fell after rising.
a) Market overview
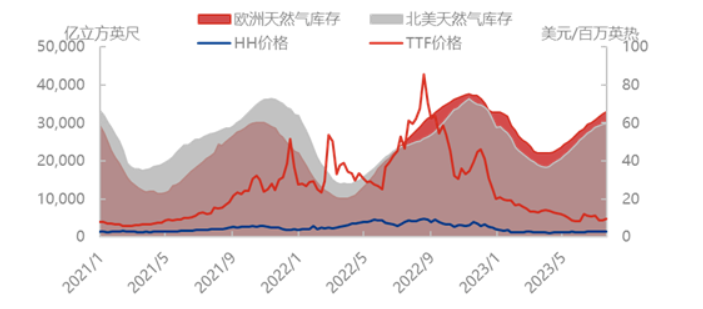
As of August 1, the United States Henry Port natural gas (NG) futures price was 2.56 US dollars/million British thermal, compared with the previous cycle (07.25) down 0.035 US dollars/million British thermal, down 1.35%; The Dutch natural gas (TTF) futures price was $8.744 / million BTU, down $0.423 / million Btu from the previous cycle (07.25), or 4.61%.
In the United States, the United States Henry Port (NG) futures prices rose and then declined during the week, the United States domestic temperatures remain high, domestic natural gas use demand is large, but on July 28 local time, the natural gas pipeline that broke down near Strasburg, Virginia, resumed normal flow, and the delivery of natural gas to the Cove Point liquefied natural gas terminal resumed normal. U.S. Port Henry natural gas (NG) futures retreated after rising.
In terms of exports, the demand of the Eurasian market is stable this week, the United States LNG exports are affected by the Panama Canal traffic policy factors, the speed of passage in Northeast Asia is limited, the United States natural gas terminal exports are forced to reduce, and the United States exports are declining.
From a technical point of view, the US Henry Port futures (NG) is a downward trend, the US Henry Port futures (NG) price to 2.57 US dollars/million BTU, KDJ continued to decline after the death fork, the downward momentum is large, the MACD still shows a downward trend after the death fork, the later will continue to decline, the US Henry Port futures (NG) price this week showed a downward trend.
In Europe, the European market inventory has declined, according to the European Natural Gas Infrastructure Association data show that as of July 31, the overall inventory in Europe is 964Twh, storage capacity share of 85.43%, 0.36% less than the previous day.
European markets are on a downward trend this week as the Troll field in Norway is reducing production beyond the scope of earlier maintenance plans, natural gas inventories rose to high but reduced, but TTF futures prices fell as stocks in the region are now too abundant.
As of August 1, the US Port Henry Natural Gas (HH) is expected to spot prices of $2.6 / mmBTU, down $0.06 / mmBTU, or 2.26%, from the previous quarter (07.25). The Canadian Natural Gas (AECO) spot price was $2.018 / mmBTU, up $0.077 / mmBTU, or 3.99%, from the previous month (07.25).
Port Henry Natural Gas (HH) expects spot prices to decline and Cove Point feedstock gas supplies to resume, but Port Henry Natural Gas (HH) expects spot prices to decline due to reduced U.S. LNG exports due to the Panama Canal flow restrictions.
As of August 1, the price of Northeast Asia spot arrival China (DES) was 10.733 US dollars/million BTU, down 0.456 US dollars/million BTU from the previous quarter (07.25), down 4.08%; TTF spot price was $8.414 / mmBTU, down $0.622 / mmBTU from the previous quarter (07.25), a decrease of 6.88%.
The spot price of the mainstream consumption place has a downward trend, the demand in Europe and Asia has remained stable as a whole, the inventory in the local market has remained sufficient, and the market has maintained oversupply, which has led to the decline in spot prices around the country.
b) Inventory
As of the week ended July 21, according to the report of the U.S. Energy Agency, the United States natural gas inventory was 2,987 billion cubic feet, an increase of 16 billion cubic feet, or 0.54%; Inventories were 5,730 cubic feet, or 23.74%, higher than a year ago. That’s 345 billion cubic feet, or 13.06%, above the five-year average.
In the week ended July 21, according to the data of the European Gas Infrastructure Association, European natural gas inventories were 3,309,966 billion cubic feet, up 79.150 billion cubic feet, or 2.45%; Inventories were 740.365 billion cubic feet higher than a year ago, an increase of 28.81%.
This week, the temperature in Europe and the United States has gradually increased, and the demand for natural gas in the region has increased, driving the increase in natural gas consumption, and driving the growth rate of natural gas inventories in Europe and the United States has declined, among which the upstream supply in the United States has weakened, and the growth rate of inventories has declined greatly.
International natural gas inventory trends
c) Liquid import and export
This cycle (07.31-08.06) the US is expected to import 0m³; The expected export volume of the United States is 3700000m³, which is 5.13% lower than the actual export volume of 3900000m³ in the previous cycle.
At present, Eurasian LNG import demand remains stable, affected by the Panama Canal flow restrictions, the United States LNG exports have decreased.
a) Market overview
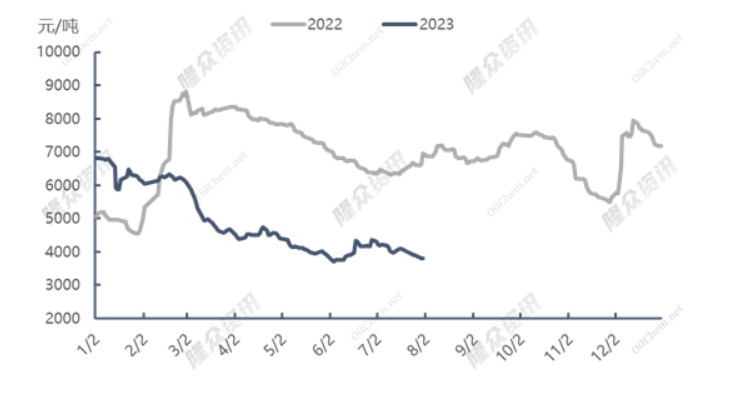
As of August 2, the LNG receiving station price was 4106 yuan/ton, down 0.61% from last week, down 42.23% year-on-year; The price of the main producing area was 3,643 yuan/ton, down 4.76% from last week and 45.11% year-on-year.
Domestic upstream prices showed a downward trend, the cost of domestic liquid resources fell, driving upstream shipments, receiving stations as a whole remained stable, and the overall market shipment price declined.
As of August 2, the average price of LNG received nationwide was 4,051 yuan/ton, down 3.09% from the previous week and down 42.8% year-on-year. Downstream demand is weak, upstream price cuts dominate downstream prices, and market receiving prices decline.
As of August 2, the total inventory of domestic LNG plants was 306,300 tons on the same day, up 4.43% from the previous period. Due to the impact of the typhoon, upstream shipments were blocked, and upstream sales continued to reduce prices, but downstream demand was weak, and factory inventories rose.
Domestic LNG price chart
 b) Supply
This week (07.27-08.02) 233 domestic LNG plant operating rate survey data show that the actual production of 635,415 million square, this Wednesday operating rate of 56.6%, the same as last week. This Wednesday’s effective capacity operating rate of 56.59%, down 2.76 percentage points from last week. The number of new plants for shutdown and maintenance is 4, with a total capacity of 8 million cubic meters/day; The number of newly resumed factories was 7, with a total capacity of 4.62 million cubic meters/day. (Note: Idle capacity is defined as production discontinued for more than 2 years; Effective capacity refers to the LNG capacity after excluding idle capacity. The total domestic LNG production capacity is 159.75 million cubic meters/day, with 28 long-term shutdowns, 7.29 million cubic meters/day of idle capacity and 152.46 million cubic meters/day of effective capacity.
In terms of sea liquid, a total of 20 LNG carriers were received at 14 domestic receiving stations in this cycle, with the number of ships receiving 1 ship less than last week, and the port arrival volume of 1.403 million tons, up 13.33% from 1.26 million tons last week. The main source countries of imports in this cycle are Australia, Qatar and Russia, with arrivals of 494,800 tons, 354,800 tons and 223,800 tons, respectively. In terms of receiving stations, CNOOC Dapeng and State Grid Diafu received 3 ships, CNOOC Zhuhai and State Grid Tianjin each received 2 ships, and the other receiving stations each received 1 ship.
c) Demand
Total domestic LNG demand this week (07.26-08.01) was 702,900 tons, a decrease of 10,500 tons, or 1.47%, from last week (07.19-07.25). Domestic factory shipments totaled 402,000 tons, down 0.17 million tons, or 0.42%, from last week (07.19-07.25). Liquid factory sales reduced prices, but due to the typhoon transit, affecting upstream shipments, the total volume of domestic factory shipments decreased slightly.
In terms of sea liquid, the total volume of shipments of domestic receiving stations was 14327 vehicles, down 2.86% from 14749 vehicles last week (07.19-07.25), and the overall decline in the price of receiving stations was smaller, and the market sales radius was narrowed, which led to a decrease in shipments of tanks.6
Post time: Aug-04-2023