


European markets remained high and volatile this week, and the situation in the Middle East forced Chevron to shut down its offshore gas field in Syria, and the market continued to panic, but TTF futures prices were high and volatile due to the current market oversupply.
In the United States, due to sluggish demand and the weakening of panic, the United States LNG exports have declined this week, exports have decreased, and the supply of raw gas from export terminals has weakened, but due to the change of NG futures contracts this month, the price of natural gas in the United States has risen.
a) Market overview
As of October 24, the United States Henry Port natural gas (NG) futures price was 3.322 US dollars/million British thermal, compared with the previous cycle (10.17) increased by 0.243 US dollars/million British thermal, an increase of 7.89%; The Dutch natural gas (TTF) futures price was $15.304 / mmBTU, up $0.114 / mmBTU from the previous cycle (10.17), or 0.75%.
In the United States, the United States Henry Port (NG) futures prices showed a rebound trend after the overall decline in the week, the United States natural gas futures prices showed a downward trend this week, but due to the impact of contract change, NG futures prices rose.
On the export side, US LNG exports fell this week due to sluggish demand and waning panic, and exports have decreased.
From a technical point of view, the United States Henry Port futures (NG) is a low state to rise, the United States Henry Port futures (NG) price to 3.34 US dollars/million British fever near, KDJ low is about to rise out of the fork, MACD below zero bottoming, the decline has stopped, the United States Henry Port futures (NG) price this week showed a downward rebound trend.
In Europe, the European market inventory continued to increase, according to the European Natural Gas Infrastructure Association data show that as of October 23, the overall inventory in Europe was 1123Twh, with a capacity share of 98.63%, an increase of 0.05% on the previous day, and a steady increase in inventory.
European markets remained high and volatile this week, and the situation in the Middle East forced Chevron to shut down its offshore gas field in Syria, and the market continued to panic, but TTF futures prices were high and volatile due to the current market oversupply.
As of October 24, the US Port Henry Natural Gas (HH) is expected to spot prices of $2.95 / mmBTU, up $0.01 / mmBTU from the previous quarter (10.17), an increase of 0.34%. Canadian Natural Gas (AECO) spot price was $1.818 / mmBTU, up $0.1 / mmBTU from the previous month (10.17), an increase of 5.83%.
Henry Port Natural Gas (HH) expects spot prices to remain stable, LNG exports have weakened, the main consumer market demand outside the region to remain stable, no obvious positive support, Henry Port Natural gas (HH) is expected to remain stable spot prices.
As of October 24, the Northeast Asia spot arrival China (DES) price was $17.25 / million BTU, up $0.875 / million BTU from the previous quarter (10.17), an increase of 5.34%; TTF spot price was $14.955 / mmBTU, up $0.898 / mmBTU from the previous quarter (10.17), an increase of 6.39%.
Mainstream consumer spot prices are rising trend, the current main consumer panic filled, market speculation mentality is strong, upstream sellers high price sales, driving the main consumer prices have risen.
b) Inventory
For the week ended Oct. 13, according to the U.S. Energy Agency, U.S. natural gas inventories were 3,626 billion cubic feet, an increase of 97 billion cubic feet, or 2.8%; Inventories were 3,000 cubic feet, or 9.0%, higher than a year ago. That’s 175 billion cubic feet, or 5.1%, above the five-year average.
For the week ended October 13, European gas inventories stood at 3,926.271 billion cubic feet, up 43.34 billion cubic feet, or 1.12%, from the previous week, according to the European Gas Infrastructure Association. Inventories were 319.287 billion cubic feet, or 8.85%, higher than a year earlier.
This week, the US natural gas inventory rose steadily, due to the high spot prices, leading to importers more wait-and-see attitude, the main consumer market spot purchase demand fell sharply, the US inventory growth rate rose. Inventories in Europe have grown steadily, now rising to nearly 98%, and the decline in inventory growth is expected to slow down in the future.
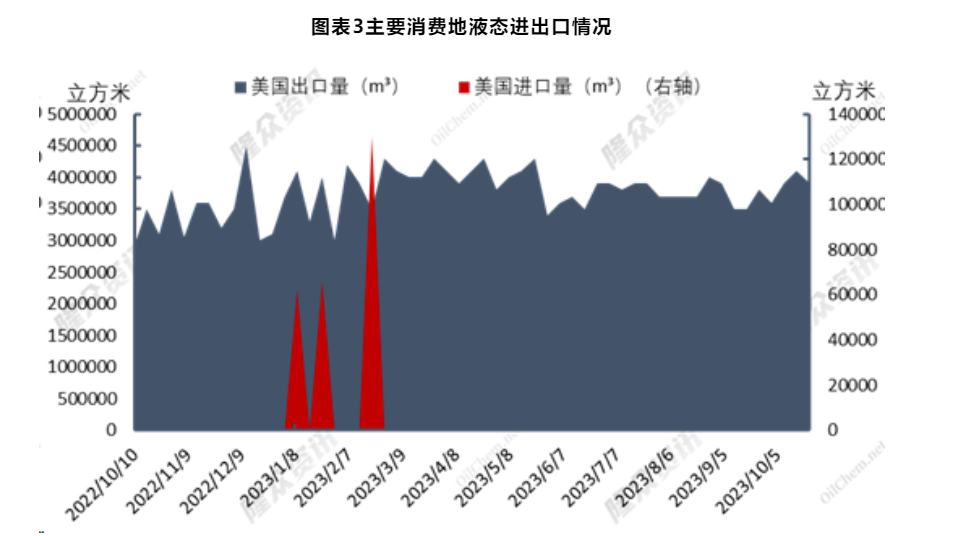
c) Liquid import and export
The US is expected to import 0m³ in this cycle (10.23-10.29); The United States is expected to export 3,900,000 m³, which is 4.88% lower than the actual export volume of 410,00,000 m³ in the previous cycle.
At present, weak demand in the main consumer market and high inventories have led to a decline in U.S. LNG exports.
a) Market overview
As of October 25, the LNG terminal price was 5,268 yuan/ton, up 7% from last week, down 32.45% year-on-year; The price of the main producing area was 4,772 yuan/ton, up 8.53% from last week and down 27.43% year-on-year.
Upstream prices show an upward trend. Due to the rising cost of the Northwest liquid plant and the high spot price of sea liquid, upstream prices are raised and shipments are driven by the rising shipment prices.
As of October 25, the average price of LNG received nationwide was 5208 yuan/ton, up 7.23% from last week and down 28.12% year-on-year. Upstream resources are affected by the cost of shipment, driving the market to receive goods prices higher.
As of October 24, the total inventory of domestic LNG plants was 328,300 tons on the same day, down 14.84% from the previous period. As the upstream successively raised prices and sold goods, the early resource sales were smoother, which led to a decline in inventory.
b) Supply
This week (10.19-10.25) the operating rate of 236 domestic LNG plants research data show that the actual production of 742.94 million square, this Wednesday operating rate of 64.6%, stable last week. This Wednesday’s effective capacity operating rate of 67.64%, up 0.01 percentage points from last week. The number of new plants for maintenance and shutdown is 1, with a total capacity of 700,000 cubic meters/day; The number of newly resumed factories is 0, with a total capacity of 0 million square meters/day. (Note: Idle capacity is defined as production discontinued for more than 2 years; Effective capacity refers to the LNG capacity after excluding idle capacity. The total domestic LNG production capacity is 163.05 million cubic meters/day, with 28 long-term shutdowns, 7.29 million cubic meters/day of idle capacity and 155.76 million cubic meters/day of effective capacity.)
In terms of sea liquid, a total of 20 LNG carriers were received at 13 domestic receiving stations in this cycle, an increase of 5 ships over the previous week, and the port volume was 1,291,300 tons, 37.49% compared with 939,200 tons last week. The main import source countries in this cycle are Australia, Qatar and Malaysia, with port arrivals of 573,800 tons, 322,900 tons and 160,700 tons, respectively. At each receiving station, CNOOC Dapeng received 3 ships, CNPC Caofeidian and CNOOC Binhai received 2 ships each, and the other receiving stations received 1 ship each.
c) Demand
The total domestic LNG demand this week (10.18-10.24) was 721,400 tons, a decrease of 53,700 tons, or 6.93%, from the previous week (10.11-10.17). Domestic factory shipments totaled 454,200 tons, a decrease of 35,800 tons, or 7.31%, from the previous week (10.11-10.17). Due to the receiving station and liquid plant have raised the price of shipment, the late downstream high price reception resistance, driving the shipment reduction.
In terms of sea liquid, the total volume of shipments of domestic receiving stations was 14,055 vehicles, down 9.48% from 14,055 vehicles last week (10.11-10.17), the receiving station raised the price of shipments, downstream shipments were more resistant, and the overall volume shipments of tanks declined.
Post time: Oct-27-2023